
Are the Dice in Mario Party Fair?
This post originally appeared on my everyday analytics blog in January of 2019. It is reproduced in its entirety as it originally appeared.
The full code can be found in the gitub repo: marioparty_dicesim
Introduction
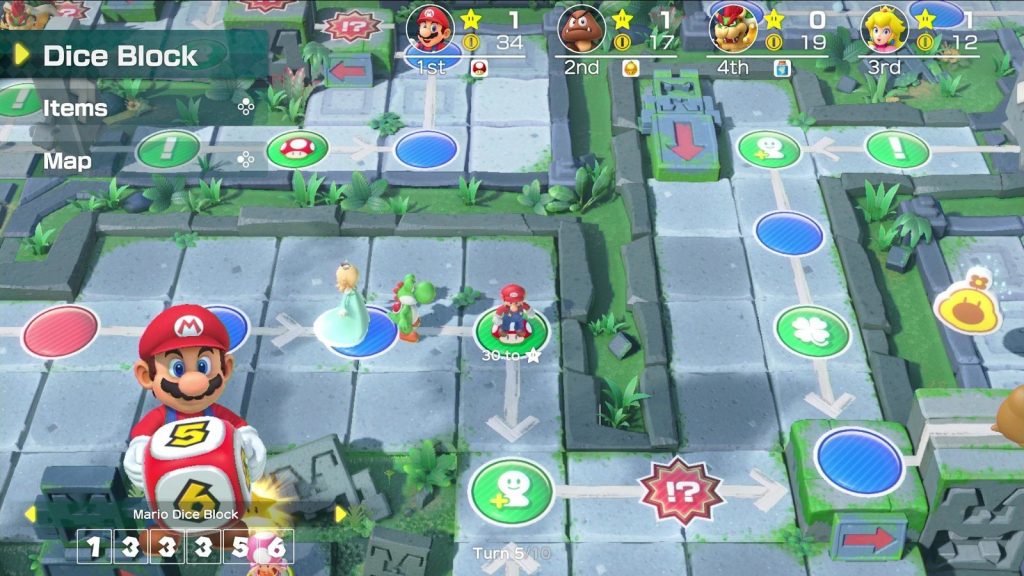
Over the holidays I was playing a lot of games with friends and family as one does, and one of those games was Super Mario Party for Nintendo Switch.
Now what’s interesting about this game is that, in addition to requiring dice rolls like any other board game, depending upon your character (or various ‘allies’ you can acquire when you team up with other playable characters and get the option to use their dice in addition to a bonus) you can choose to use different character-specific dice which are unique and have different values than a standard one.
So, being the guy that I am this got me to wondering – are all the different dice for the different characters ‘fair’? If your goal is to traverse the maximum number of spaces (as it often is) are any of the dice better to use on average than the others?
Background
Actually, to be honest, the question I was specifically wanting to know the answer to and also answers the above was: what is the expected value of each of the dice?
Put simply, expected value is the average value of an action with a random outcome (in this case, the roll of a six-sided die) over a very large number of repetitions.
Mathematically speaking: For a random variable \(\mathbf{X}\) with a finite number of possible outcomes \(\mathbf{x_{1}, x_{2}, \cdots, x_{k}}\) occurring with probabilities \(\mathbf{p_{1}, p_{2}, \cdots, p_{k}}\), what is the average value of \(\mathbf{X}\) for \(i\) trials as \(i\to\infty\)?
The answer is the expected value or expectation and is given by the expression below :
\[E[X]=\sum _{i=1}^{k}x_{i}\,p_{i}=x_{1}p_{1}+x_{2}p_{2}+\cdots +x_{k}p_{k}\]For a regular six-sided die, the probability of each outcome is 1⁄6th, so the answer is
\[\begin{align*} E[X] &= \sum _{i=1}^{k}x_{i}\,p_{i}=x_{1}p_{1}+x_{2}p_{2}+\cdots +x_{k}p_{k} \\ &=1(\frac{1}{6}) + 2(\frac{1}{6}) + 3(\frac{1}{6}) + 4(\frac{1}{6}) + 5(\frac{1}{6}) + 6(\frac{1}{6}) \\ &=\frac{1}{6}(1+2+3+4+5+6) \\ &=\frac{21}{6} \\ &= 3.5 \end{align*}\]Which as you can see is just the weighted average, and in the case of a regular die, since all sides are equally probable, is just the simple average (sum of sides divided by 6).
So over many, many rolls, we’d expect the average to converge to be 3.5. Now let’s take a look at the dice of the Mushroom Kingdom, shall we?
Analysis
A listing of the different Mario Party characters and their dice values has already been put together on RankedBoost here, which I have duplicated below:
| Characters | Dice Roll | Rank |
|---|---|---|
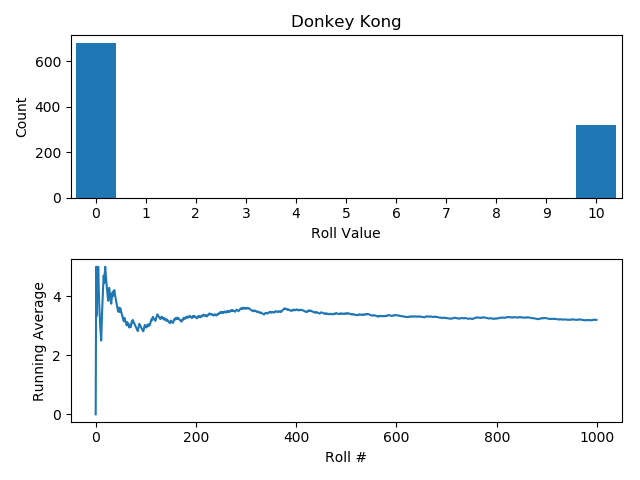
| Donkey Kong | +5 0 0 0 10 10 | S |
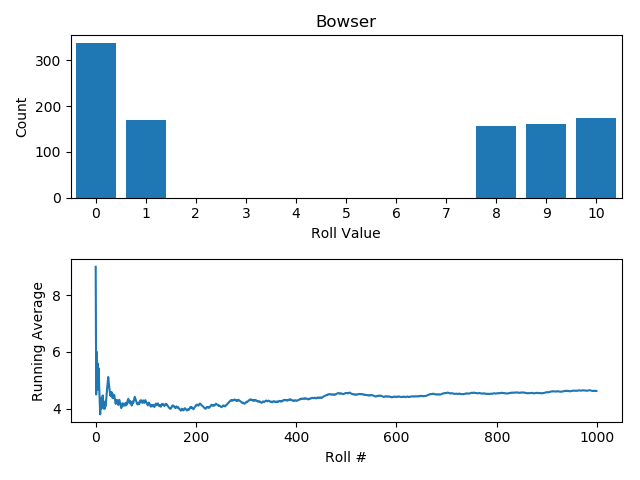
| Bowser | -3 -3 1 8 9 10 | S |
| Boo | -2 -2 5 5 7 7 | S |
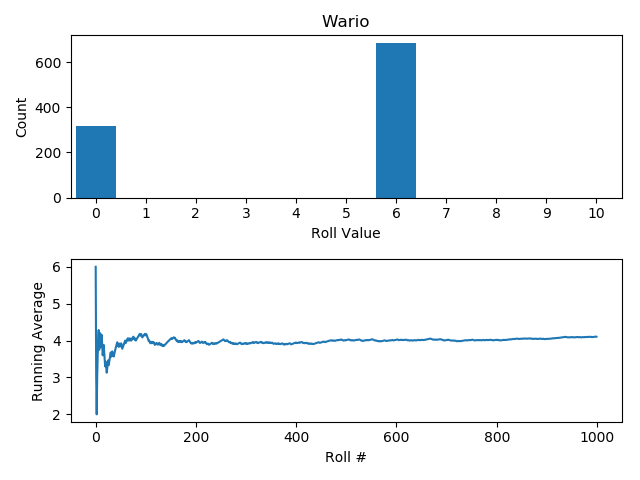
| Wario | 6 6 6 6 -2 -2 | S |
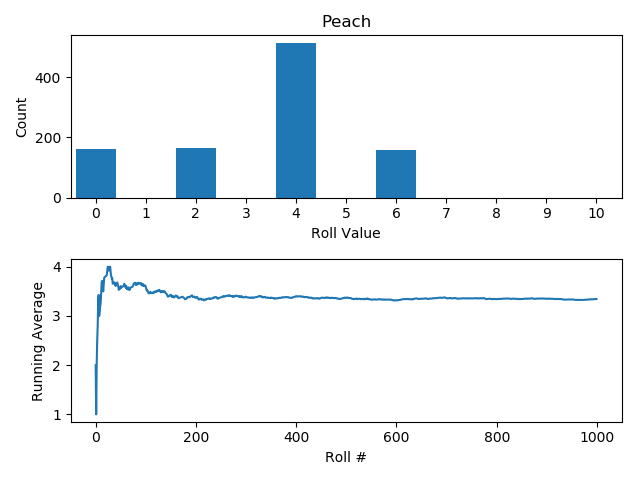
| Peach | 0 2 4 4 4 6 | A |
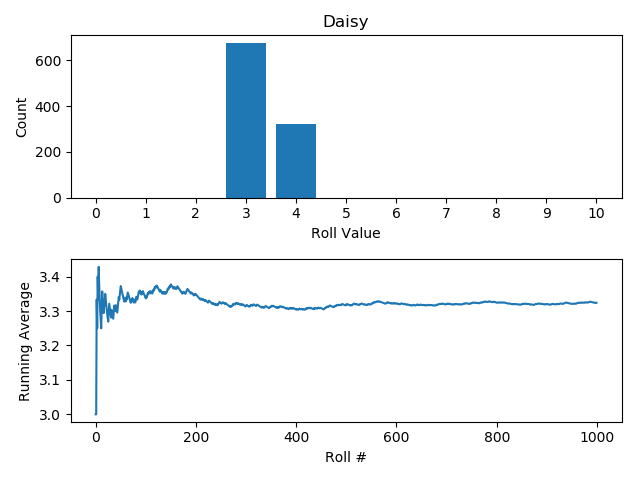
| Daisy | 3 3 3 3 4 4 | A |
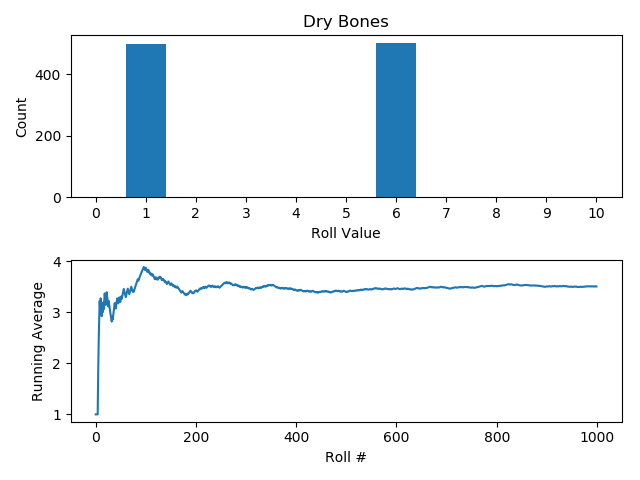
| Dry Bones | 1 1 1 6 6 6 | A |
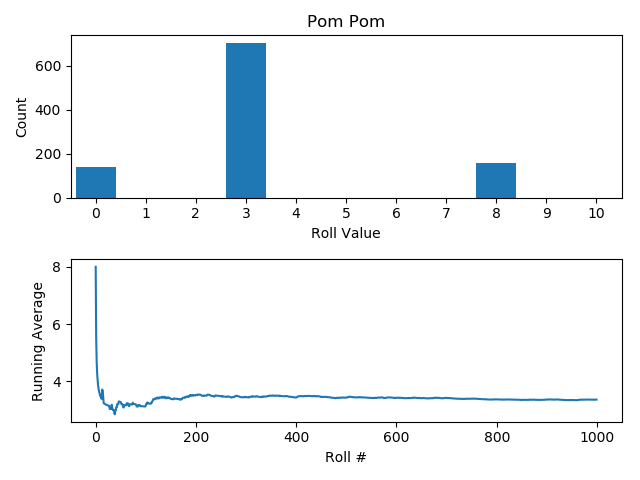
| Pom Pom | 0 3 3 3 3 8 | A |
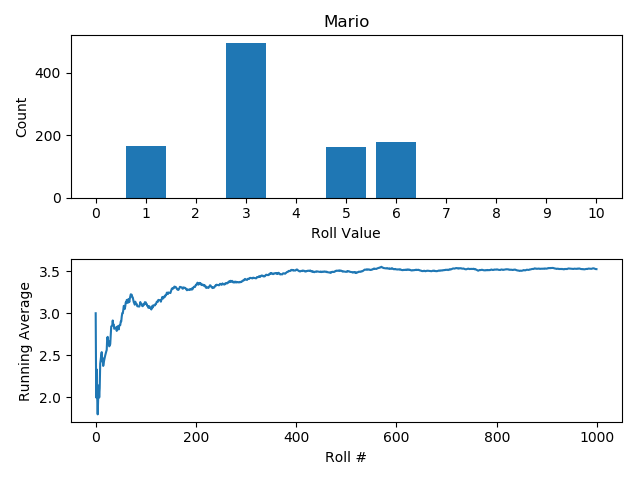
| Mario | 1 3 3 3 5 6 | B |
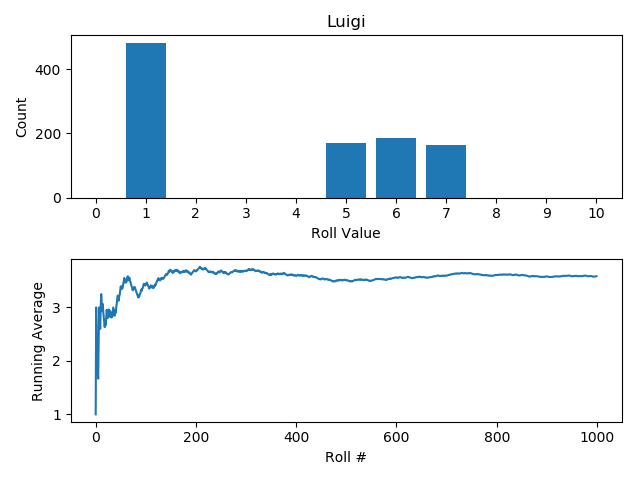
| Luigi | 1 1 1 5 6 7 | B |
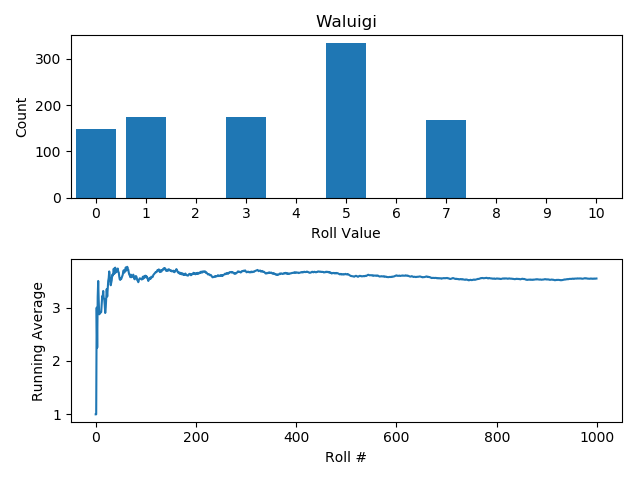
| Waluigi | -3 1 3 5 5 7 | B |
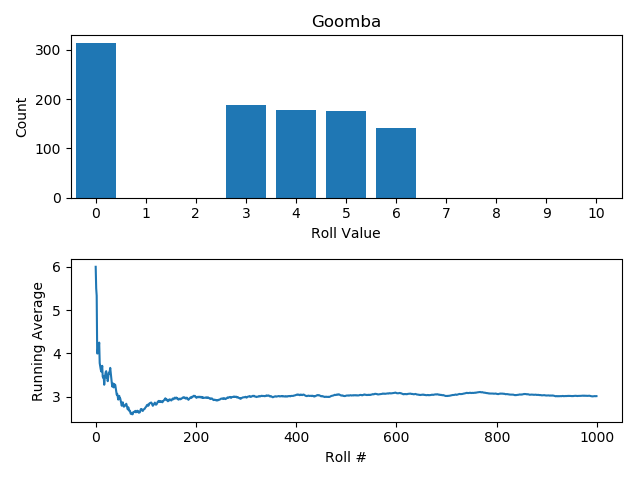
| Goomba | +2 +2 3 4 5 6 | B |
| Bowser Jr. | 1 1 1 4 4 9 | B |
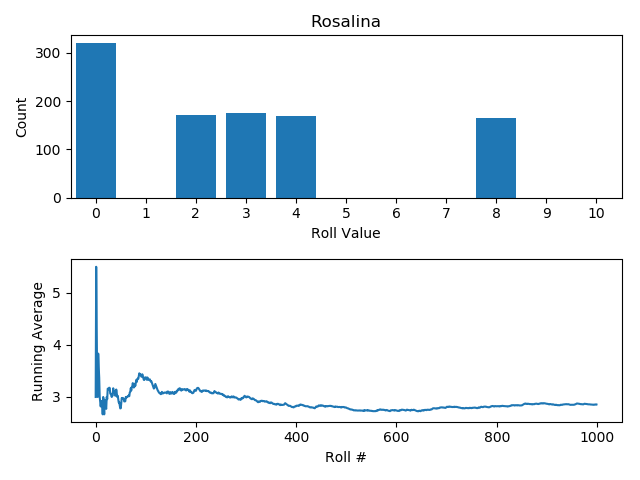
| Rosalina | +2 +2 2 3 4 8 | C |
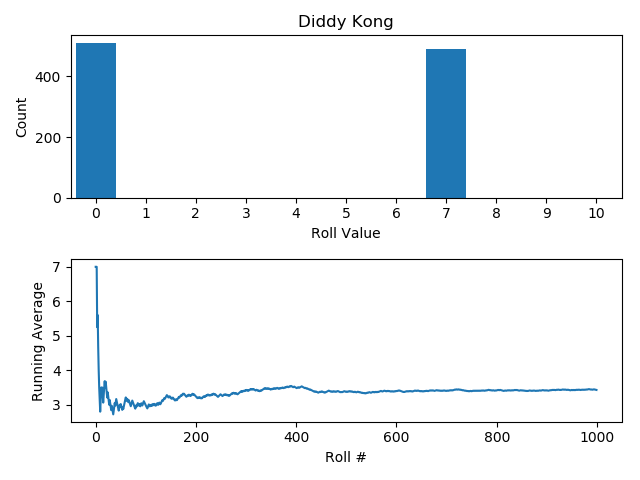
| Diddy Kong | 0 0 0 7 7 7 | C |
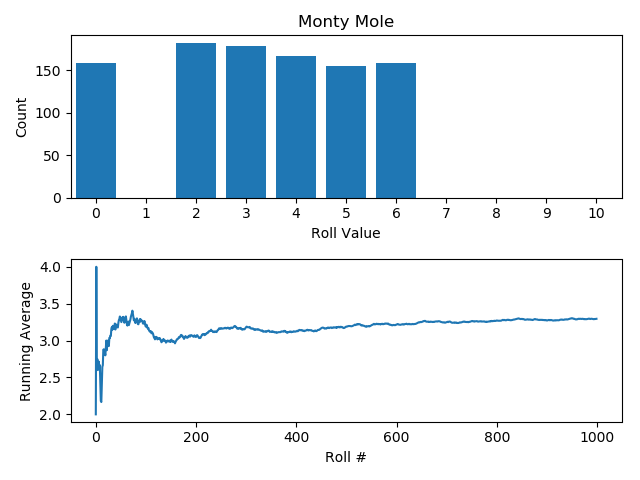
| Monty Mole | +1 2 3 4 5 6 | D |
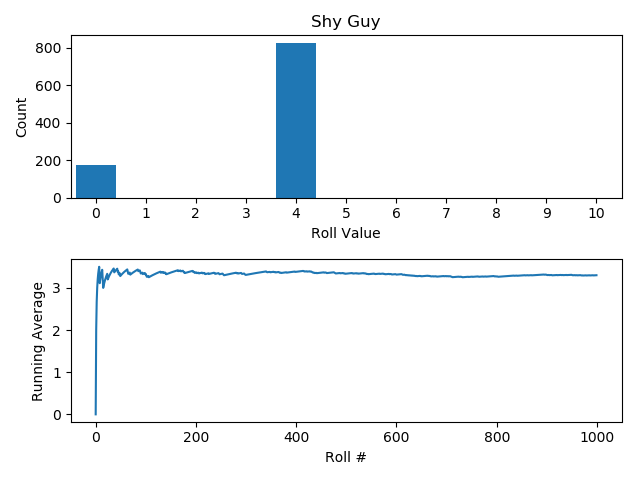
| Shy Guy | 0 4 4 4 4 4 | D |
| Yoshi | 0 1 3 3 5 7 | F |
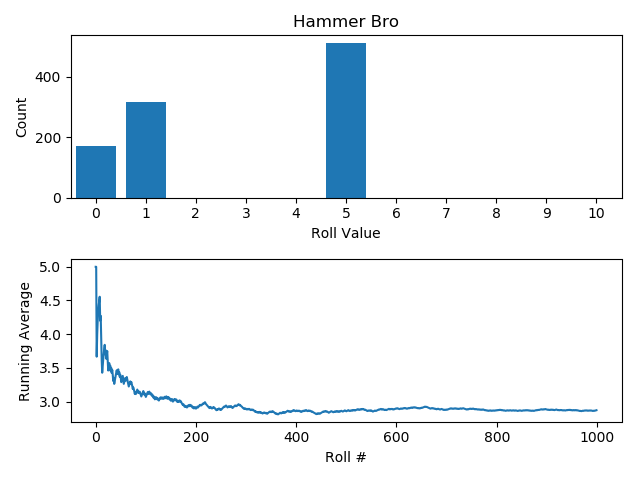
| Hammer Bro | +3 1 1 5 5 5 | F |
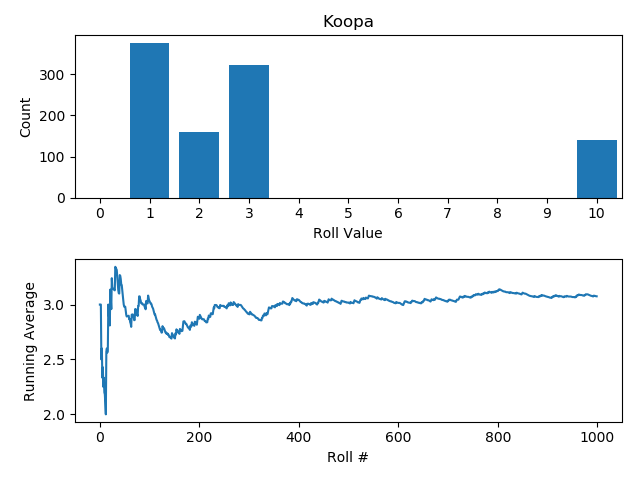
| Koopa | 1 1 2 3 3 10 | F |
How will our analysis compare with what RankedBoost said? The plus (+) and minus (-) correspond to gaining or losing coins, which for our intents and purposes we will ignore and count as a roll of 0 (since the character does not move). Calculating the expected value for each, we get the following graph below:
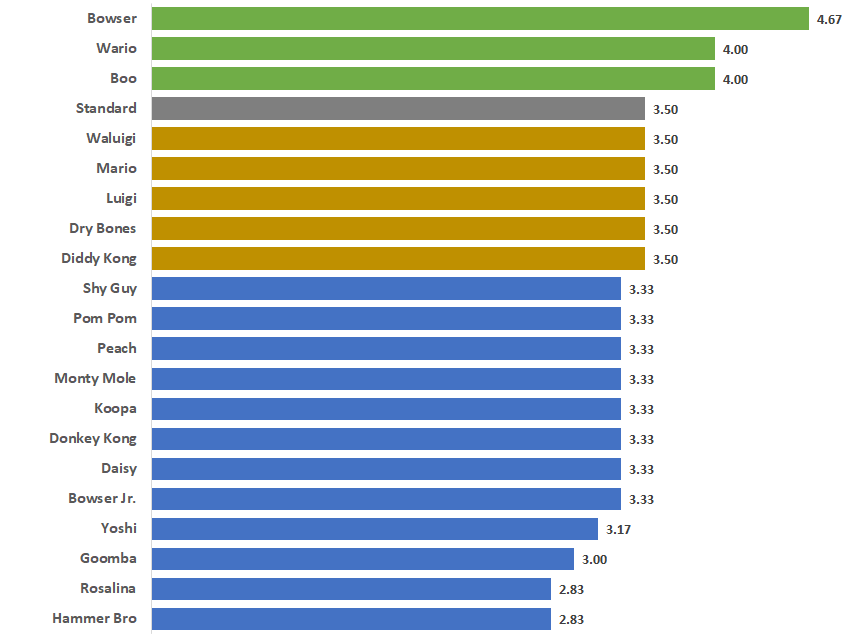
You can see that most of the dice on average, are actually equal or worse than the standard die – however, the offset to this is that many are giving the player coins instead of movement (and in some cases it is actually advantageous to remain in the same spot). Overall, if you want to move many, many, spaces in the long run you’re best using Bowser, Wario, or Boo’s dice. This is consistent with the top of RankedBoost’s rankings, other than for Donkey Kong, which is ranked quite lower since we are not considering coins.
And now a little python to take the data and simulate an arbitrary number of rolls and see how the expected value converges for each of the dice (code on Github here):
import numpy as np
import pandas as pd
import matplotlib.pyplot as plt
dice_dict = {
'Boo': [0,0,5,5,7,7],
'Bowser': [0,0,1,8,9,10],
'Bowser Jr.': [1,1,1,4,4,9],
'Daisy': [3,3,3,3,4,4],
'Diddy Kong': [0,0,0,7,7,7],
'Donkey Kong': [0,0,0,0,10,10],
'Dry Bones': [1,1,1,6,6,6],
'Goomba': [0,0,3,4,5,6],
'Hammer Bro': [0,1,1,5,5,5],
'Koopa': [1,1,2,3,3,10],
'Luigi': [1,1,1,5,6,7],
'Mario': [1,3,3,3,5,6],
'Monty Mole': [0,2,3,4,5,6],
'Peach': [0,2,4,4,4,6],
'Pom Pom': [0,3,3,3,3,8],
'Rosalina': [0,0,2,3,4,8],
'Shy Guy': [0,4,4,4,4,4],
'Waluigi': [0,1,3,5,5,7],
'Wario': [6,6,6,6,0,0],
'Yoshi': [0,1,3,3,5,7],
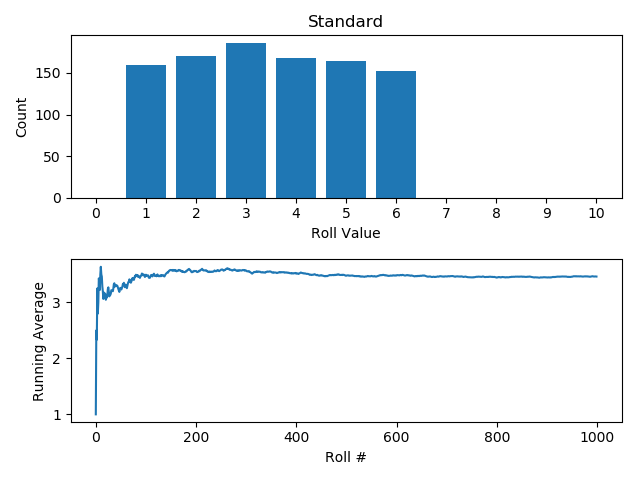
'Standard': [1,2,3,4,5,6]
}
def simulate_rolls(dice, n):
# Generate the roll index
roll_index = np.arange(0, n, 1) + 1
# Generate the random rolls (face #)
roll_faces = np.random.randint(0, 6, n)
# Map faces to the different dice values
f = np.vectorize(lambda x: dice[x])
# Apply to get all the random dice rolls
rolls = f(roll_faces)
# Calculate the running average
roll_avg = np.cumsum(rolls)/roll_index.astype(float)
return rolls, roll_avg
def plot_rolls(rolls, rolls_avg, label):
# Find uniques and counts
roll_values, count = np.unique(rolls, return_counts=True)
fig = plt.figure()
# Top plot
ax = plt.subplot(2,1,1)
ax.bar(roll_values, count)
ax.set_title(label)
plt.xlim(-0.5, 10.5)
plt.xticks(range(0, 11, 1))
plt.xlabel('Roll Value')
plt.ylabel('Count')
# Bottom plot
ax = plt.subplot(2,1,2)
ax.plot(rolls_avg)
plt.xlabel('Roll #')
plt.ylabel('Running Average')
plt.tight_layout()
# Save
plt.savefig('./output/'+label+'.png')
plt.close()
if __name__ == "__main__":
# Iterate over each dice, simulate 1000 rolls and plot
for (character, dice) in dice_dict.iteritems():
rolls, rolls_avg = simulate_rolls(dice, 1000)
plot_rolls(rolls, rolls_avg, character)
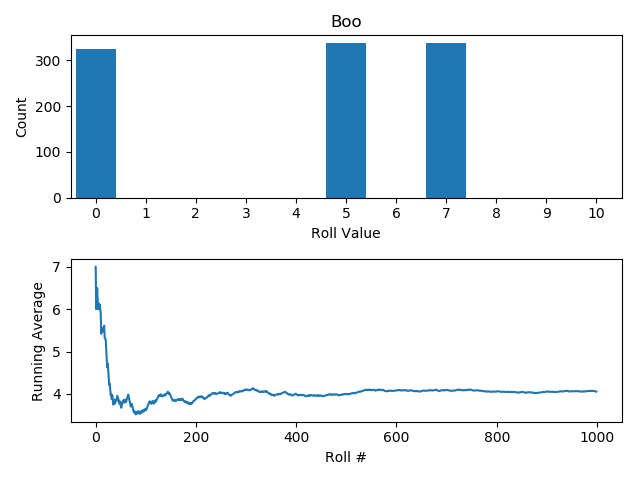
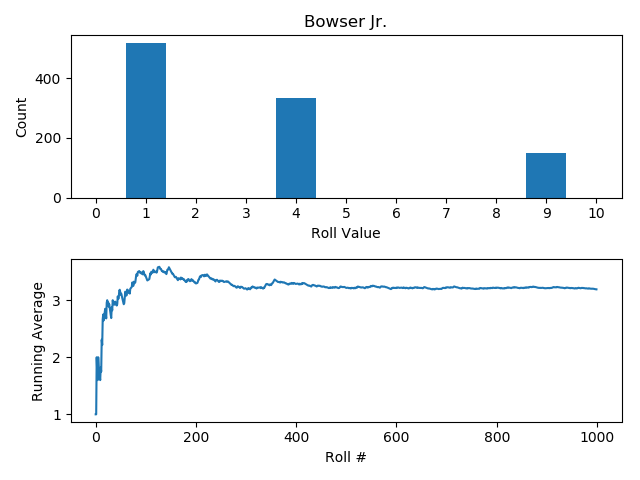
From the plotting function we get the following output for each of the characters below. The convergence to the expected value would be different each time the simulation is run (since it is random), however you can still see by the range of the y-axis for the second plots that the range is quite narrow for some dice and wider for others.
 |
 |
 |
 |
 |
 |
 |
 |
 |
 |
 |
 |
 |
 |
 |
 |
 |
 |
 |
 |
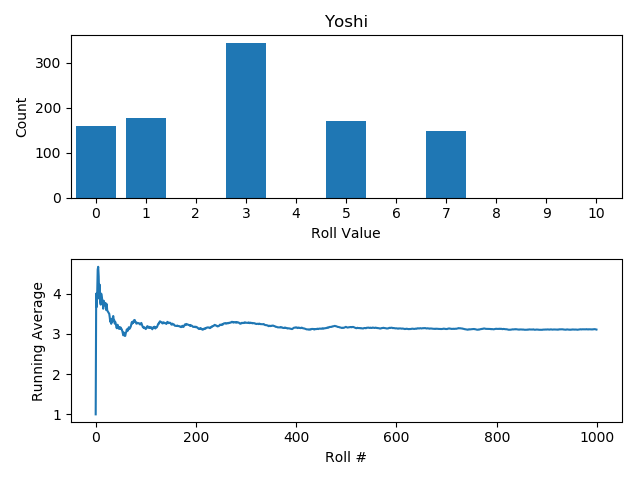 |
You can see that some converge quite quickly, and have a narrow range when there are only a few values or values close together (e.g. Daisy) whereas others with a wide spread between values or many different values converge a slower (e.g. Hammer Bro, Koopa).
Conclusion
So, are the dice in Super Mario Party ‘fair’? That is a resounding no. However, I suppose we shouldn’t expect them to be, given that they are likely designed to have their advantages and disadvantages to make the game more interesting. That being said, there are some that are noticeably much worse as others have already noted (e.g. Hammer Bro, Yoshi).
And, of course, as with any statistics there is the usual proviso – the behaviour on average in the long run is often very different from the here and now you care about, and it really all depends on what outcome you’re after.